Inform Decisions.
THE POWER OF QuANTITATIVE DATA & USER FLOWS
My last company struggled with taking perceptions of user behavior and stating those as fact. There was a disconnect in these perceptions and the quantitative data being seen. In generative interviews with our users, it was made clear that quantitative data needed to be paired with qualitative data to truly understand how the users navigated through our platform.
The business tends to have an idea of how they want a user to move through their platform, but users will surprise you. It’s also important to remember, we are not always the same as our users.
Quantitative Research
Third Party Analytics
Before any feature is released you must identify what actions the user could take and document those. These actions equate to an event that you need to create within your analytics system. All events must have the same naming convention. This enables anyone to explore the data and understand what they are seeing. Before the feature is shipped to production, you should set up the events you plan to track.
Create a Hypothesis
When you are creating a feature, you should create at least one hypothesis for the data you are going to collect. You want to be able to test against your ideas of feature adoption. This also gives the business better understanding of the product team’s intention.
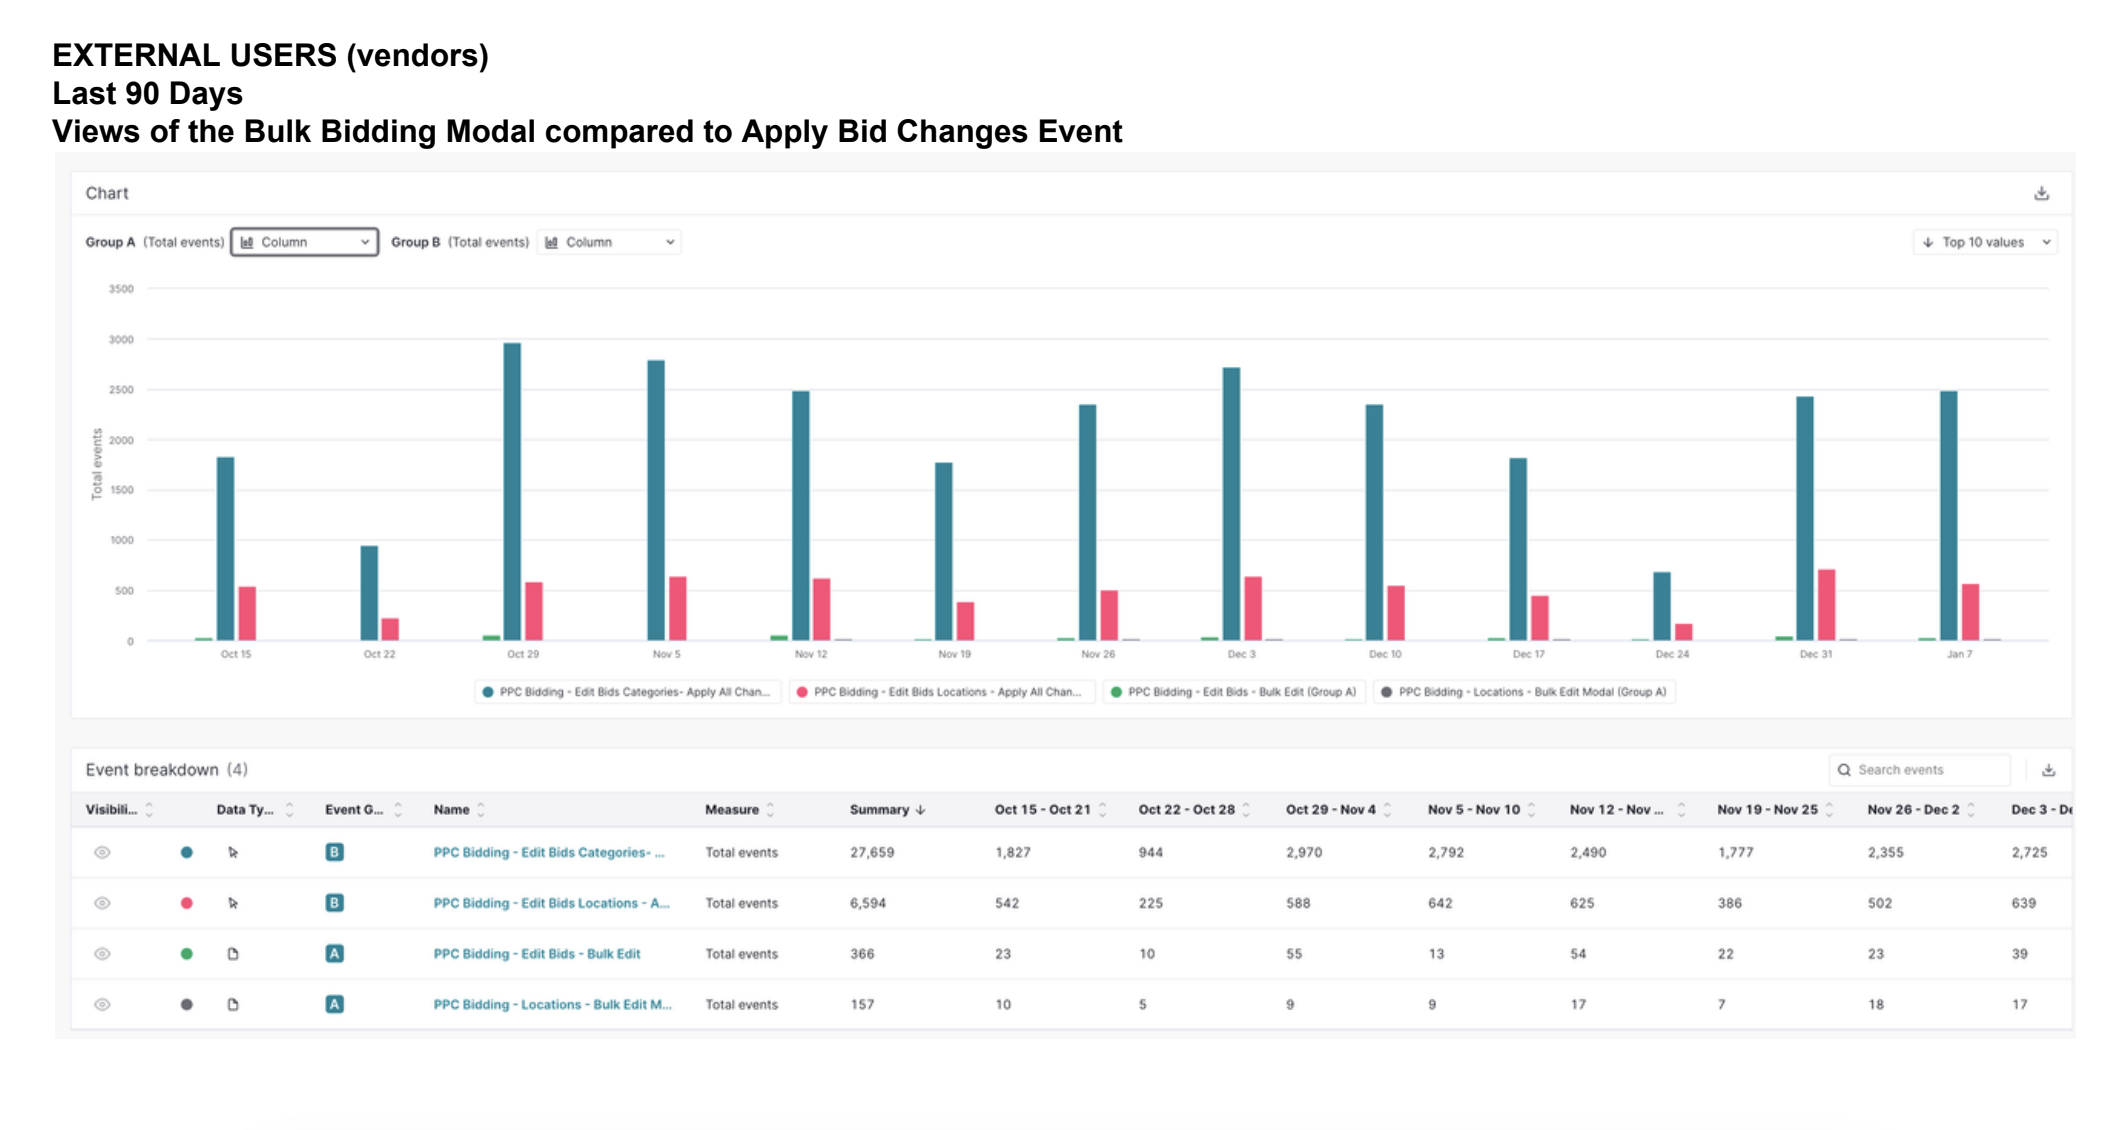
Data in Action
Since my company hadn’t focused on quantitative data, I took on the task of setting up our third party analytics systems, Pendo and Google Analytics. I reviewed our entire application from log in to log out and created a tagging mechanism for all of our events. I then worked with our development team to prioritize getting events properly tagged in our codebase to enable easy attribution within our analytics systems.
During this process, I established the foundation of our quantitative data collection and became the SME of our application’s analytics systems. We now had rules around when to begin tagging events, how to tag events, how to identify user flows and how to present data externally from our team.
Qualitative & User Flow Data
A few of the most useful data collection tools for understanding user flows include: heat map tracking, qualitative interviews, customer testimonials, surveys, internal feedback loops.
By combining data from the methods mentioned with quantitative data you are able to get a fuller picture of user interaction.
Before and after I conduct user interviews, I take a look at the user data for the participant in my interview. This includes: login frequency, top performed events, top click or event paths, etc. This allows me to compare the actual data with the user’s intention. This also allows me to ask more targeted and informed questions during the interview process.